Utilising a Portfolio
When a Portfolio has been created, you can start to leverage the interface to make decisions about existing and future projects. Currently, the data comparisons are based around four typical areas of project management:
- Budget
- Resources
- Timeline
- Quality
The exact specifications of the data contained in Portfolios is as follows:
Budget
Metrics within the Budget section are focussed on the Portfolio’s overall Sold vs. Logged performance.
| Budget Metrics | Data Source | ||
| 01.01 | Resources Budget | Combined resources of associated estimates | Total value of included estimates’ resources |
| 01.02 | Resources Spent | Total value of logged hours | 02 |
| 01.03 | Remaining Resources Budget | [Total] – [Spent] | 01.01 – 01.02 |
| 01.04 | Pass-Through Budget | Total pass-through budget | Total value of estimates’ P/T |
| 01.05 | Pass-Through Spent | Spent pass-through value | User entered data |
| 01.06 | Remaining Pass-Through Budget | Remaining pass-through budget | 01.04 – 01.05 |
| 01.07 | Project Budget | 01.01 + 01.04 | |
| 01.08 | Project Budget Spent | 01.02 + 01.05 | |
| 01.09 | Project Budget Remaining | 01.07 – 01.08 | |
Resources
Metrics within the Resources section are focussed upon the Sold vs. Logged performance of individuals within the Portfolio.
| Resources Metrics | Data Source | ||
| 02.01 | Resources Sold | List of all resources sold | Total value of included estimates’ resources |
| 02.02 | P/resource Hours Sold | P/resource: number of hours sold | Estimo |
| 02.03 | P/resource Hours Logged | P/resource: number hours logged | Jira & user/resource matchup |
| 02.04 | P/resource Hours Remaining | P/resource: hours remaining | 02.02 – 02.03 |
| 02.05 | P/resource Value Sold | P/resource: total value sold | Estimo |
| 02.06 | P/resource Value Logged | P/resource: total value logged | Jira & user/resource matchup |
| 02.07 | P/resource Value Remaining | P/resource: total value remaining | 02.05 – 02.06 |
| 02.08 | Totals | Totals of each column | |
| 02.09 | Unassigned | Hours that have not been assigned to individuals | |
Timeline
The Timeline section displays the Milestones contained in the selected Estimates, allowing them to be checked off as a project progresses.
| Timeline Metrics | Data Source | ||
| 03.01 | Deliverable | Consolidated list of deliverables | Estimo |
| 03.02 | Start Date | Deliverable start date | Estimo |
| 03.03 | End Date | Deliverable end date | Estimo |
| 03.04 | Complete | Tickbox | Estimo |
Quality
The Quality view enables users to understand the number of quality issues within a Jira project, and the amount of time spent resolving them.
| Quality Metrics | Data Source | ||
| 04.01 | Total ‘Bugs’ | Total number of ‘Bugs’ in selected Jira projects | Jira Bug issue type |
| 04.02 | Open ‘Bugs’ | Number of open ‘Bugs’ in selected Jira projects | Jira Bug issue type, with Open status |
| 04.03 | Bugs Resolution | Time spent resolving ‘Bugs’ in selected Jira projects | Total time logged against Jira Bug issues |
Resource Usage Over Time
This view provides a visualisation of time logged in the Jira projects attached to the Estimo Portfolio, split by the different resource categories:
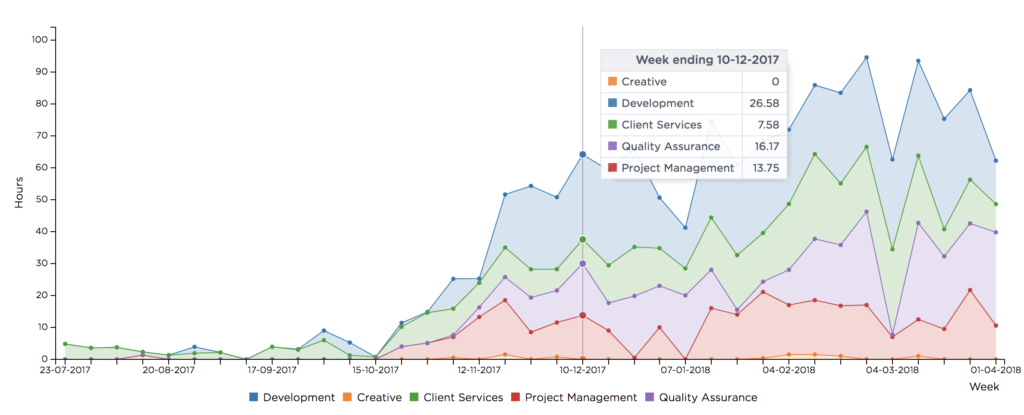
This visualisation is particularly useful for Project Managers, tracking project budgets. It also gives an ‘at a glance’ view for management, who are looking for patterns across multiple projects.